Configuring Funnel Charts
Overview
Funnel charts are highly effective for visualizing linear processes or sequences, making them an excellent tool for identifying trends, drop-offs, and conversion rates at each stage. They help track progression through various stages while highlighting potential bottlenecks.
Getting Started
Before configuring a Funnel Chart, ensure you have:
- A dataset with sequential or stage-wise data
- A clear goal for your analysis
- Understanding of your conversion process
Business Value
- Identify bottlenecks in workflows
- Visualize conversion rates across stages
- Highlight areas for process optimization
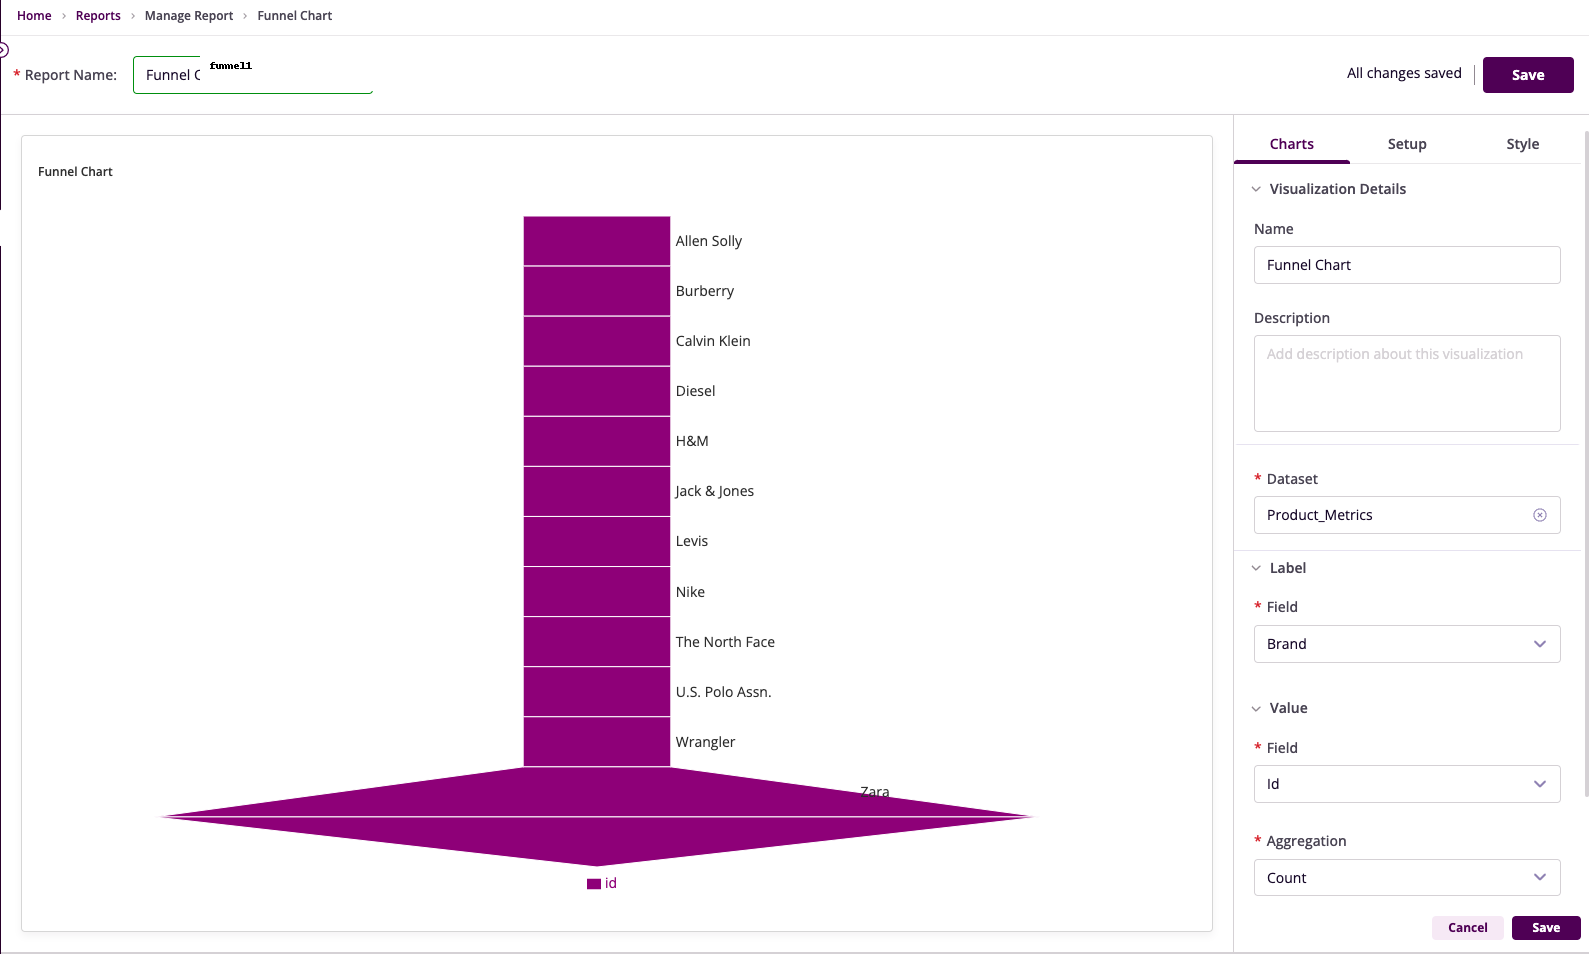
Chart Configuration
Basic Configuration
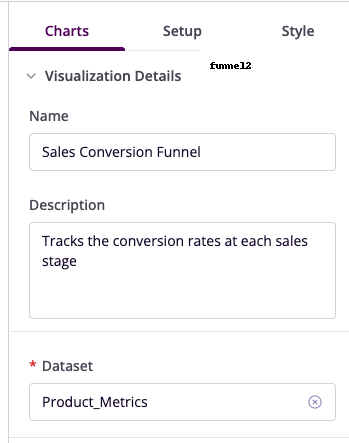
- Name: Provide a descriptive title
- Description: Add context about purpose
- Dataset: Select relevant dataset
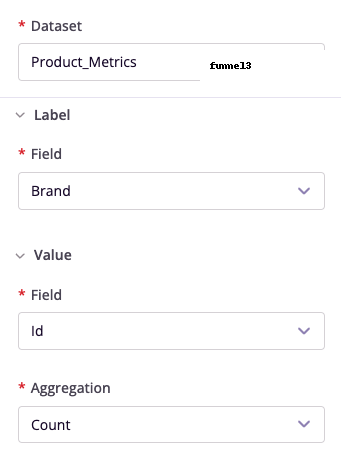
Field Configuration
- Label Field: Select stages column
- Value Field: Choose metric column
- Aggregation: Select calculation method
- Alias: Set friendly names
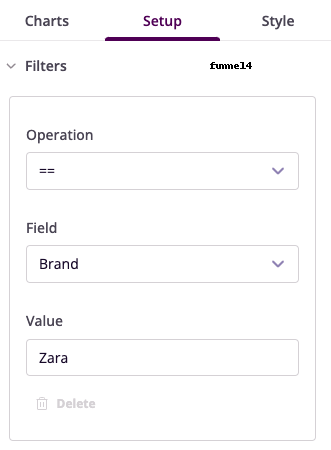
Advanced Features
Filter Configuration
- Operation: Choose conditional operator
- Field: Select column to filter
- Value: Set filter criteria
- Operator: Combine multiple filters
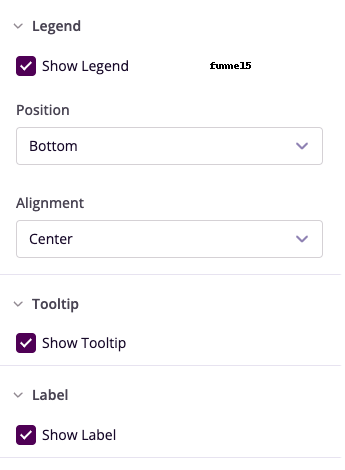
Legend and Tooltip
- Show Legend: Toggle visibility
- Position: Set legend location
- Show Tooltip: Enable hover details
- Show Label: Configure section labels
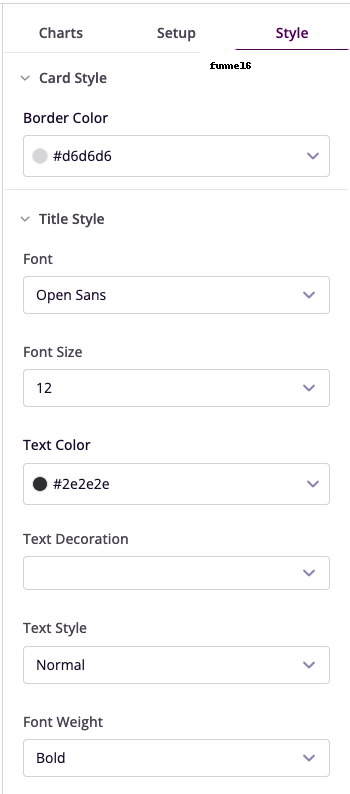
Style Customization
- Card Style: Set border colors
- Title Style: Configure font properties
- Visual Elements: Adjust appearance
Example Use Cases
Sales Pipeline Analysis
- Label Field: Sales Stage
- Value Field: Number of Leads
- Aggregation: Sum
- Insight: Track lead progression
Marketing Campaign Conversion
- Label Field: Engagement Stage
- Value Field: Number of Users
- Filters: Campaign Type = "Email"
- Insight: Analyze engagement drop-offs